Chapter 9: Finding Trends in Reddit Data
Parts of social media data are structured in ways that enumerate human actions quantitatively, while other parts are very qualitative in nature. For example, we can measure the popularity of a Reddit post by counting its upvotes. This allows us to do simple aggregations like the average or median number of upvotes that posts have received during a specific period of time. Other parts of the same Reddit data, however, may be more difficult to summarize in quantitative ways. Comments, for instance, contain prose that can vary wildly in content and style.
Summarizing what people are talking about, and how they’re talking about it, is much harder than calculating averages of engagement metrics like upvotes, but doing meaningful analyses of data from the social web requires us to navigate both kinds of information. Learning how to do this can be quite rewarding, though, because it lets us explore the behavior, thoughts, and reactions of real people (and the occasional and perhaps ever-more-prominent bot).
In this chapter, you’ll learn how to navigate both qualitative and quantitative information. We’ll explore how people are engaging with the topic of vaccinations in social media by analyzing the r/askscience data from Chapter 8 and ask targeted questions from our data set. First we’ll try to better understand how to handle text-based information by searching this subreddit for submissions that feature the word stem vaccin (in words like vaccinate and vaccination). Then we’ll compare the engagement metrics—the combined number of comments and upvotes—of the vaccine posts to those of non-vaccine posts.
Clarifying Our Research Objective
For this chapter, we’ll use online conversations from the r/askscience subreddit, a popular forum for Reddit users to ask and answer questions related to science, to measure how vigorously vaccinations are discussed on the web.
While Reddit users are not representative of the entire US population, we can try to understand how controversial this topic is on this particular forum by looking at it relative to other topics on the platform. The key here, as in any other examination of the social web, is to acknowledge and understand the specificity of each data set we examine.
We’ll begin by asking a very rudimentary question: do r/askscience Reddit submissions that include variations of the word vaccination, vaccine, or vaccinate elicit more activity than r/askscience subreddit submissions that don’t?
Outlining a Method
Our analysis consists of the following steps:
- Filter and group our data into two data frames. The first data frame will contain all submissions that use the words vaccine, vaccinate, or vaccination. The second data frame, which we’ll compare to the first, will contain the submissions that don’t mention those words.
- Run simple calculations on each data frame. Summarizing our data by finding mean or median engagement counts (in this analysis, engagement counts are represented by the combined number of comments and upvotes), can help us better understand each subset of the r/askscience data received, and formulate an answer to our research question.
It’s worth taking a second to clarify the terms used here. The mean is the result of taking all the values from a data set, adding them, and dividing their sum by the total number of values. The median is the number that appears halfway through the data set. To find it, first we need to sort all the values in the data set from smallest to largest. The number that is exactly midway between the smallest and the largest value is the median. If there’s an even number of values, you’d take the mean of the two numbers in the middle. Both the mean and median are measures of central tendency, metrics that allow us to assess a data set by looking at some central point. When a data set contains a lot of values without many outliers, means are a great way to measure its central tendency. A data set with outliers, on the other hand, may be better measured through medians. In this chapter, we’ll look at both measures for our analysis.
Narrowing the Data’s Scope
Reddit data sets can be fairly large, even when you’re looking only at a single subreddit. While it’s important to start with as comprehensive a data set as possible, filtering the data based on your specific project gives you a better, less cluttered overview of it. Filtering also reduces the amount of time it takes to run each calculation.
This chapter also introduces the concepts of population and sample data. Population data describes a data set that contains the entirety of a specified group. In this case, this specified group comprises any submission posted between 2014 and 2017 in the r/askscience subreddit. Sample data, as the name suggests, is a subset or a sample of the data set. In this exercise, there will be two subsets: one consisting of submissions related to vaccinations (which we’ll define in the coming pages) and one consisting of all other submissions. We’ll run analyses on both of these subsets to compare them.
We’ll use the virtual environment and Jupyter Notebook project set up in Chapter 8. The following exercises are intended to expand on that particular notebook, and you’ll use the same variable names we established there.
Selecting Data from Specific Columns
To filter the data for our task, first we’ll pare it down to include only the columns that contain information relevant for our analysis. Then we’ll drop the rows that contain irrelevant samples, like null values.
Let’s start by selecting the columns we need. We’re particularly interested in two different kinds of data—the title of the submission, including the text that was submitted to r/askscience, and the reactions that the submissions garnered. As mentioned in the previous chapter, we can see all the column names as a list by running this line of code:
reddit_data.columns
This should render a list of strings, each representing a column name:
Index(['approved_at_utc', 'archived', 'author', 'author_cakeday',
       'author_flair_css_class', 'author_flair_text', 'banned_at_utc',
       'brand_safe', 'can_gild', 'can_mod_post', 'contest_mode', 'created',
       'created_utc', 'crosspost_parent', 'crosspost_parent_list',
       'distinguished', 'domain', 'edited', 'from', 'from_id', 'from_kind'
       'gilded', 'hidden', 'hide_score', 'id', 'is_crosspostable',
       'is_reddit_media_domain', 'is_self', 'is_video', 'link_flair_css_class',
       'link_flair_text', 'locked', 'media', 'media_embed', 'name',
       'num_comments', 'over_18', 'parent_whitelist_status', 'permalink',
       'pinned', 'post_hint', 'preview', 'quarantine', 'retrieved_on', 'saved',
       'score', 'secure_media', 'secure_media_embed', 'selftext', 'spoiler',
       'stickied', 'subreddit', 'subreddit_id', 'subreddit_type',
       'suggested_sort', 'thumbnail', 'thumbnail_height', 'thumbnail_width',
       'title', 'ups', 'url', 'whitelist_status'],
      dtype='object')
There are 62 column names here. For the sake of this analysis, it makes sense for us to keep the columns containing the titles listed in the title column, the upvotes listed in the up column, and the number of comments on each submission listed in the num_comments column.
Just as we did in the previous chapter, we can now select specific columns in our data set using square brackets. Make sure you’re still in the notebook from Chapter 8 and that you’ve run each cell. (Remember: if you’ve run it, the cell should have a number in the square brackets to its left.) Then, using the plus sign (+), add a cell under all the other cells and type the lines from Listing 9-1 into it:
columns = ["title", "ups", "num_comments"]
ask_science_reduced = reddit_data[columns]
Listing 9-1: Selecting a few columns from a data set
We first create a variable called columns to which we assign a list of strings. The strings in our list (“title”,”ups”,”num_comments”) represent the column headers for every column we want to include in our filtered data set. Make sure that the string of each column name exactly matches the string of the column header, down to the punctuation, capitalization, and spelling—minor mistakes can throw off the Python script.
In the next line, we create the variable ask_science_reduced, which stores a smaller data frame containing only the columns listed in the columns variable. Notice that instead of adding a single string inside the square brackets, as we did before, we now put the variable columns within them. Putting an entire list inside the brackets instead of one string allows us to select multiple columns.
Now that we’ve pared down our data to specific columns, let’s drop rows of data containing values that aren’t relevant to our analysis.
Handling Null Values
In a large, inconsistent data set, chances are that some rows or cells won’t contain any information. These “empty” cells may hold either no values at all or a placeholder, an arbitrary string used by the institution or person who designed the data structure. If we’re lucky, that placeholder will be described in a data dictionary, a document explaining the contents, structure, and format of a data set. Otherwise, we have to figure it out ourselves through research or, in the worst-case scenario, through sophisticated guesses based on the column names. (Fortunately, in this case we knew the person who collected the data and were able to field questions with him.)
In data parsing, we refer to these empty cells as null values. In Python, null values may be returned as None when we try to print them in our interactive shells or other Python interfaces. In pandas they may be referred to as NaN values (where NaN stands for “not a number”), and the rows of the data frame will display NaN as a placeholder for missing values.
Null values are particularly common in columns that gather information on actions that are optional for social media users. For instance, a column that collects links to videos posted to Facebook contains values only for posts where a user actually published a video. For any post that does not include videos, the data set will not have a value for that cell and may either use a placeholder, like the string “no video”, or leave the cell empty, meaning it’ll have a None value.
The issue is that placeholder, None, and NaN values can cause errors in analyses. When we apply functions or calculations, our script will run these calculations as instructed, until it gets to an empty cell. We’ll cover two ways to handle null values, each with a slightly different purpose for data analysts: one drops these null values from the analysis altogether, while the other preserves the entirety of a data set and counts empty rows as zeros.
Dropping Null Values
We may choose to exclude entire rows of data if they contain null values for specific columns. The pandas library makes this easy for us with the dropna() function. Listing 9-2 shows the code that drops entire rows of data based on whether columns contain NaN values.
ask_science_dropped_rows = ask_science_reduced.dropna(

    subset=["ups", "num_comments"])
Listing 9-2: Dropping rows with NaN values in specific columns
With no specifications, this function tells pandas to drop whole rows from the data frame. But the dropna() function also comes with helpful parameters, like the subset parameter. In this example, we use subset to tell pandas to drop rows that contain NaN values in the ups and num_comments columns. (If we do not pass the dropna() function any arguments, pandas defaults to dropping rows that have any null values and will look for NaN values in every column of the data frame.)
Filling Null Values
To account for NaN values but preserve every row of the data frame, we can use the fillna() function to fill each empty cell with a string or a number instead of removing it. Listing 9-3 shows how to use the fillna() function to fill the empty cells in the num_comments column with the number 0:
ask_science_data["num_comments"] = ask_science_data["num_comments"].fillna(value=0)
Listing 9-3: Filling in the null values with 0
Within the parentheses of the fillna() function, we assign 0 to the value parameter. This code replaces the num_comments column with a modified version of itself that now contains zeros in lieu of NaN values.
Deciding whether to remove null values or fill them depends on your data set and how you want to answer your research question. For example, if we wanted to get the median number of comments for our entire data set, we might ask whether it’s safe to assume that missing values simply mean that there were no comments on the submission. If we decide it is, we can fill those values with a 0 and calculate accordingly.
Depending on the number of rows that contain missing values or “empty cells,” the median number of comments may shift significantly. However, because this data set does sometimes record the number of comments or upvotes as zeros and sometimes as null values, we can’t automatically assume that rows that contain null values for those columns should be treated as zeros (if null values represented zeros, it may be reasonable to assume that the data set would not contain any actual zeros). Instead, maybe this is data that our archivist was unable to capture; maybe the posts were deleted before he could gather that information; or maybe those metrics were introduced for some of those years but not for others. Thus, for the sake of our exercise, we should work with the data we do have and drop the rows of data that do not contain a value for the ups or the num_comments columns, as we did in Listing 9-2.
Classifying the Data
The next step is to filter our data based on our specific research question about vaccinations. We need to classify what we consider a Reddit submission about vaccination.
This classification will be reductive. This is necessary when handling a large data set, because it’s incredibly labor-intensive to read every single post and interpret each individually. And even if we could employ a large group of people to read each post and interpret it by hand—which is not uncommon in some prose-driven projects—it’s difficult to make sure that everyone is using the same rubrics for their interpretation, which can make it difficult to categorize data in a standard, identifiable way.
In our example, we’ll limit the sample to submissions that include the word vaccinate or vaccination in some shape or form. We’ll look specifically for any title that includes vaccin. (In linguistics this is often referred to as a stem, the part of the word that is most common in various iterations and inflections of it.) This subset may not catch every post about vaccinations, but it can help us qualitatively understand the matter at hand.
We’ll start by making a new column that classifies a row based on whether its submission title contains the string “vaccin”. We’ll fill this column with a Boolean—that is, binary—value, True or False. Listing 9-4 shows the code needed to create this column:
ask_science_dropped_rows["contains_vaccin"] = ask_science_dropped_rows["title"].str.contains("vaccin")
Listing 9-4: Filtering a column based on whether it contains a certain string
On the left-hand side of the equal sign, we create a new column called contains_vaccin using square brackets. On the right side, we used a chained function: first we select the title column from our data using bracket notation, and then we use the str() function on that column to convert the values to strings so we can use contains() to determine whether column values contain vaccin.
The result of this chain is a Boolean value: if the title of the submission contains vaccin then it will return the value True; else it will return the value False. In the end, we should have a new column (contains_vaccin) with only True or False values.
Now that we have this extra column, let’s filter our data! Run the code in Listing 9-5 inside a new cell of your notebook:
ask_science_data_vaccinations = ask_science_dropped_rows[ask_science_dropped_rows["contains\
_vaccin"] == True]
Listing 9-5: Filtering data based on a conditional value
This should be familiar syntax. But notice that inside the brackets on the right-hand side, we used the condition ask_science_data_dropped_rows["contains_vaccin"] == True instead of a column title. This tells pandas to check whether the value in the contains_vaccin column equals True. To filter our data to a subset that includes only rows that do not contain the stem vaccin, we can set our conditional to equal False:
ask_science_data_no_vaccinations = ask_science_dropped_rows[ask_science_dropped_rows["contains\
_vaccin"] == False]
Now that we’ve filtered our data, let’s query it for some interesting insights.
Summarizing the Data
To determine whether r/askscience Reddit submissions that include variations of the words vaccination, vaccine, or vaccinate get a bigger reaction than r/askscience submissions that don’t, we’ll look at the posts that received the most combined reactions, defined as the sum of the count of upvotes and comments.
Note There are a number of ways to answer this question, and it’s important to recognize that fact. However, as mentioned before, in this book we’re trying to tackle calculations and analyses from the most beginner-friendly stance, which means that we may use simple ways of doing mathematical calculations. They may not be the most elegant, but they introduce some of the most foundational pandas methods, which beginners can build on as they learn more about the library.
Sorting the Data
First we’ll create a column that combines the number of upvotes and the number of comments for each row. This is a very simple operation with pandas, as shown in Listing 9-6.
ask_science_data_vaccinations["combined_reactions"] = ask_science_data\
_vaccinations["ups"] + ask_science_data_vaccinations["num_comments"]

ask_science_data_no_vaccinations["combined_reactions"] = ask_science_data_no\
_vaccinations["ups"] + ask_science_data_no_vaccinations["num_comments"]
Listing 9-6: Combining several columns into one
Here, we create a column called combined_reactions in each data frame and assign it a value equal to the sum of the num_comments and ups columns. When you run this code, you may encounter a SettingWithCopyWarning, which is what its name suggests—a warning, rather than an error (though it looks a bit menacing, since it’s displayed on a red background). The difference between an error and a warning is that the error stops your code from running, while a warning just nudges you to double-check that the code you’re running is doing what you want. For this book, we know that the code shown here does what we want it to do: add the number of upvotes to the number of comments. If you’re curious about what the developers who wrote this warning wanted you to investigate further, see http://pandas.pydata.org/pandas-docs/stable/user_guide/indexing.html.
Note When we read in the .csv file containing the data, we didn’t specify which column contained which data type (an option pandas offers as a parameter). If you don’t specify a column’s data type, pandas automatically interprets the types within columns based on what it finds (and sometimes it doesn’t assign a type to a column uniformly!). You can read more on data types in pandas under dtype at https://pandas.pydata.org/pandas-docs/stable/generated/pandas.read_csv.html.
Now that we have values for combined reactions in a column, let’s sort the values using the sort_values() function, as shown in Listing 9-7.
ask_science_data_vaccinations.sort_values(by="combined_reactions", ascending=False)

ask_science_data_no_vaccinations.sort_values(by="combined_reactions", ascending=False)
Listing 9-7: Using sort_values() to sort the data frame
As its name suggests, sort_values() sorts your data frame. We’ve passed arguments to two parameters here: by, which tells pandas which column to sort by, and ascending, which tells pandas which order to sort in. In Listing 9-7, we passed False to ascending, meaning the data will be in order from largest to smallest.
Figure 9-1 shows some of the results of our sorted data frame for the ask_science_data_vaccinations column.
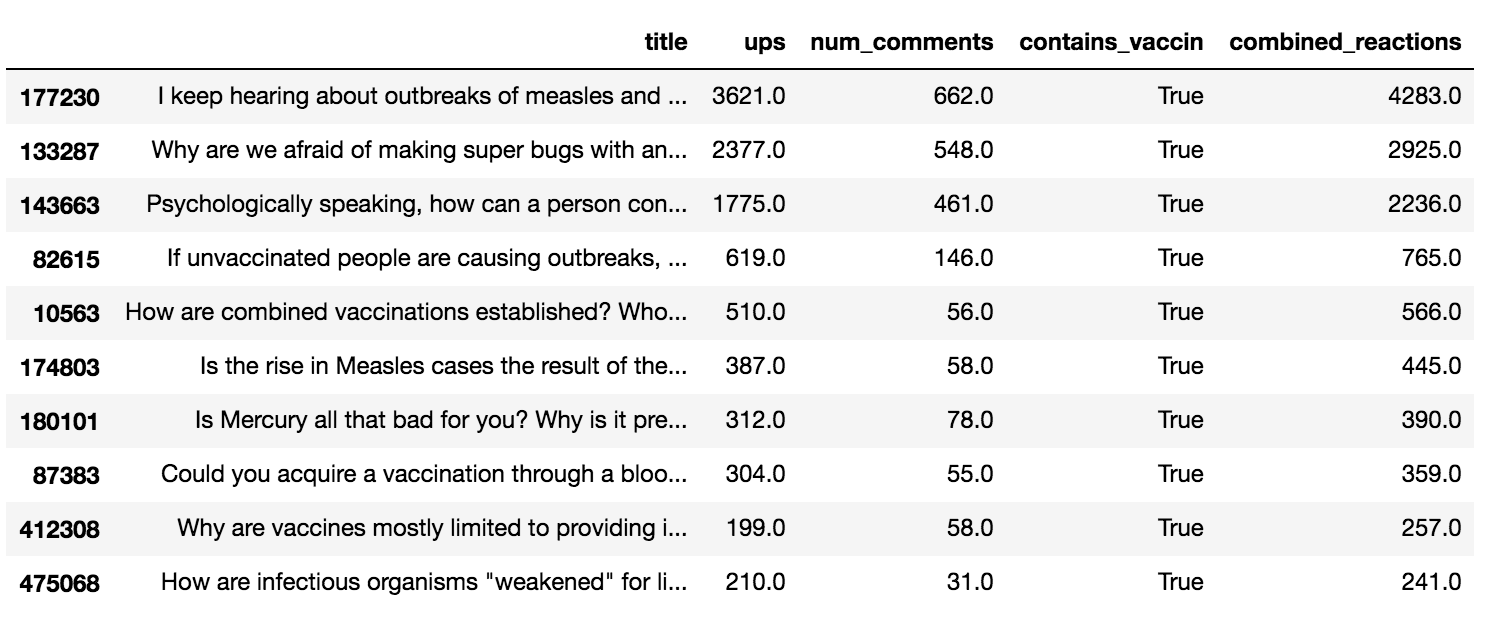
Figure 9-1: The Jupyter Notebook display of the partial data frame of the ask_science_data_vaccinations column sorted by the number of combined reactions
Figure 9-2 shows some of the results for the ask_science_data_no_vaccinations column.
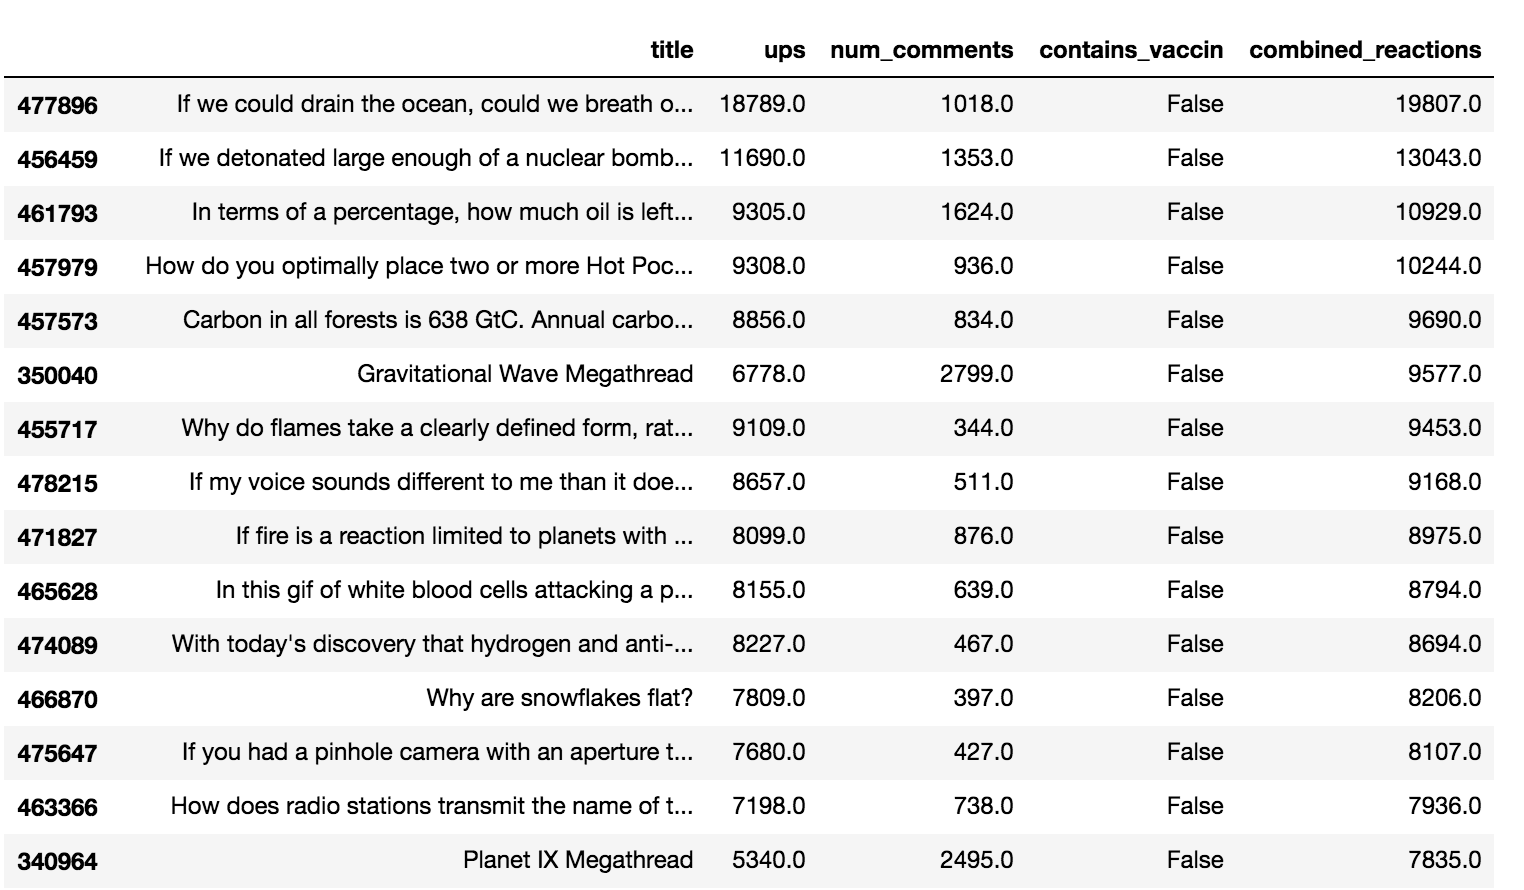
Figure 9-2: The Jupyter Notebook display of the partial data frame of the ask_science_data_no_vaccinations column sorted by the number of combined reactions
As you can see, the top submission in the non-vaccination data frame got a lot more reactions than the top submission in the vaccination-related data frame. This is also true for the top 10 biggest submissions in both data sets. The number of combined reactions for the top 10 submissions is much higher for those that do not contain the stem vaccin than it is for those that contain vaccin. So, as measured in the total number of engagements for the top 10 submissions for each subset of the r/askscience data, we might conclude that vaccination-related submissions do not garner as much attention as other topics do.
But there’s a problem here. We’ve only looked at the top 10 posts. Filtering and sorting our data sets can get us closer to a better understanding, but it shows us only a glimpse of the extreme values of a vast data set. In the next section, we’ll look at some different methods for analyzing the data further.
Describing the Data
One common way to summarize data is by using the mean() function, shown in Listing 9-8.
ask_science_data_vaccinations["combined_reactions"].mean()
Listing 9-8: The mean() function
We use the mean() function here to find the average across all values in the column we selected (combined_reactions). When you run this code in a cell, you should get the following number:
13.723270440251572
Now run the same code for the ask_science_data_no_vaccinations data frame, swapping out the name of the data frames as shown here:
ask_science_data_no_vaccinations["combined_reactions"].mean()
This should return the following:
16.58500842788498
This number shows us that the average number of combined engagement metrics for submissions that don’t contain vaccin is higher than the average number of engagements for those that do. In other words, our previous conclusion—that vaccination-related submissions solicit less engagement and, hence, may not garner as much attention from Reddit users as posts that don’t—is also supported when we look at engagement averages across the entire data set, not just when observed for the top 10 posts.
Averages are just one way to summarize values. We can look at multiple metrics at once in pandas using the describe() function, shown in Listing 9-9.
ask_science_data_vaccinations["combined_reactions"].describe()
Listing 9-9: The describe() function
If we run the code in Listing 9-9 in one cell, it should return a roster of results:
count    1272.000000
mean       13.723270
std       162.056708
min         0.000000
25%         1.000000
50%         1.000000
75%         2.000000
max      4283.000000

Name: combined_reactions, dtype: float64
This summary includes the count, or total number of rows; the mean, or average; the std, the standard deviation; the min, the smallest number in that column; the 25th, 50th, and 75th percentiles (with the 50th being the median); and the max, the largest value in that column.
Let’s run the same code in another cell for the ask_science_data_no_vaccinations data frame with the following code:
ask_science_data_no_vaccinations["combined_reactions"].describe()
If we run this code in another cell, we should get something like the following:
count    476988.000000
mean         16.585008
std         197.908268
min           0.000000
25%           1.000000
50%           1.000000
75%           2.000000
max       19807.000000

Name: combined_reactions, dtype: float64
This shows us that the median for both data frames is the same, which represents yet another way to measure the level of engagement of a post. However, here the mean is likely the best way for us to compare submissions, since the median for each data set, 1, doesn’t allow us to make clear distinctions between the engagement of one data set over another.
Last but not least, it’s important to give context to the various analyses we have just run when we present our findings. While it might be helpful to provide our audience with medians and means, it’s also crucial to be transparent about everything we did to the data. Data analyses require context to be understood: we should not only present information about the scope of the data (which we learned about in Chapter 8), but also outline how we categorized the data (in this case by looking for the stem of the word vaccination or vaccinate) and any other helpful observations that can provide more context.
One of these observations may be to look into the distribution of our subsets. As noted earlier, both the mean and the median are designed to help us measure the central tendency of a data set, but they vary quite a bit in this case: the median is 1 upvote or comment for both subsets of our data, while the mean is between 13 and 16 for the vaccination-related post and all other posts. Usually this kind of discrepancy should prompt us to examine the distribution of our data set further (we briefly covered the concept of a data set’s distribution in Chapter 7) and include some of the characteristics that may be unusual when we present our findings. For example, seeing that the median of both subsets of our data is 1, we can safely assume that at least half of the posts included in either subset garnered 1 or fewer upvotes or comments, a fact that may be worth noting.
Whatever we end up writing in a presentation, a paper, or an article, it is important to be descriptive of the data itself, the processes used, the results found, and any context that may be helpful for our audience to get a full grasp of our analysis.
Summary
In this chapter, you learned how to think through a research question using various steps like data processing, filtering, and analysis. We walked through the steps it takes to categorize and filter social media data based on the potential values in a column. We then saw how to run simple mathematical calculations on these filtered data sets.
It’s important to understand that there’s more than one way to tackle analyses like this. This can manifest itself technically: some data analysts may choose to use different functions to do the kinds of filtering and aggregation that we did in this chapter. In other cases, researchers may try to use different methodological approaches and think about different ways to categorize and summarize their data. For instance, a different developer may have used another way to classify what constitutes a post about vaccination and what doesn’t—they may have filtered their data based on more than just one search term (which in our case was vaccin). There is no surefire way to answer a question with data, despite what some strongly opinionated online users may think, though it does help to experiment more with the data we have and to try different ways to answer the same research question, as we did in this chapter.
While in this chapter we summarized our data set using categorically driven subdivisions, in the next chapter, we’ll be looking at how to summarize our data over different periods of time.